GUI의 기능성은 중요하지만, 눈에 띄는 시각적인 요소도 중요합니다. GUI 요소에 애니메이션과 동적인 움직임을 추가하여 시각적으로 매력적인 GUI를 만들 수 있습니다. 이 글에서는 PyQt6 QPropertyAnimation Framework 를 살펴보고 GUI 안에 움직이는 방법에 대해 같이 알아보겠습니다.
[목차]
1. PyQt6 QPropertyAnimation Framework 란?
PyQt6 애니메이션 프레임워크는 Qt의 애니메이션 프레임워크를 기반으로 구축되었으며, GUI에 애니메이션을 만드는 간단하고 직관적인 방법을 제공합니다. PyQt6 애니메이션 프레임워크의 기본 구성 요소는 QPropertyAnimation, QGraphicsOpacityAnimation, QSequentialAnimationGroup 세 가지입니다.
1) QPropertyAnimation
QPropertyAnimation은 QObject의 어떤 속성(위치, 크기 또는 색상)을 애니메이션화하는 데 사용됩니다. 지정된 기간 동안 현재 값과 대상 값 사이를 보간하여 작동합니다.
2) QGraphicsOpacityAnimation
QGraphicsOpacityAnimation은 QGraphicsItem 객체의 불투명도를 애니메이션화하는 데 사용됩니다. 값 사이를 보간하는 대신 불투명도 레벨 사이를 보간합니다.
3) QSequentialAnimationGroup
QSequentialAnimationGroup는 여러 애니메이션을 그룹화하여 순차적으로 재생합니다. 동시에 여러 애니메이션을 재생하기 위해 QParallelAnimationGroup도 사용할 수 있습니다.
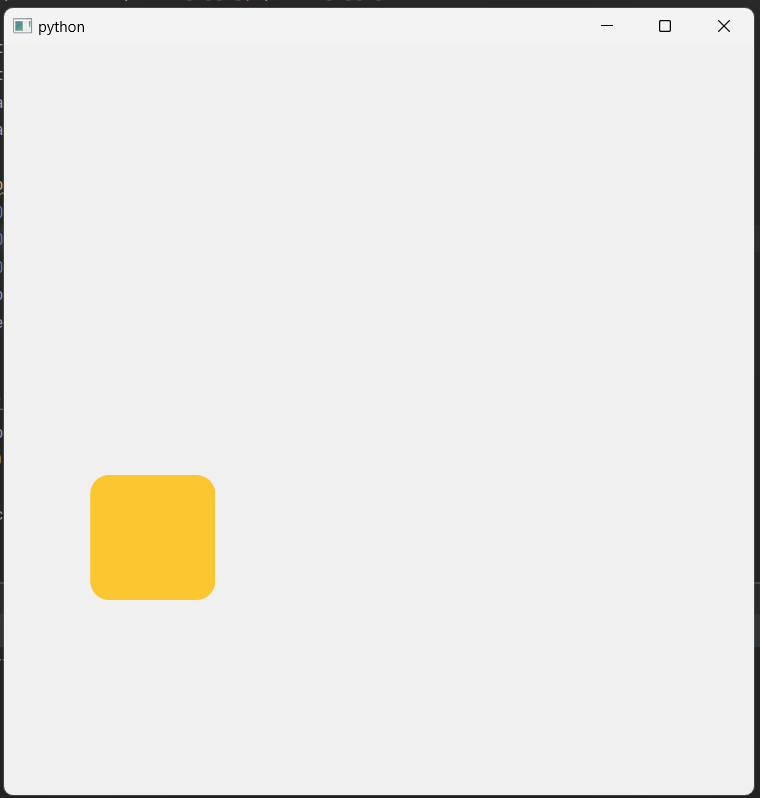
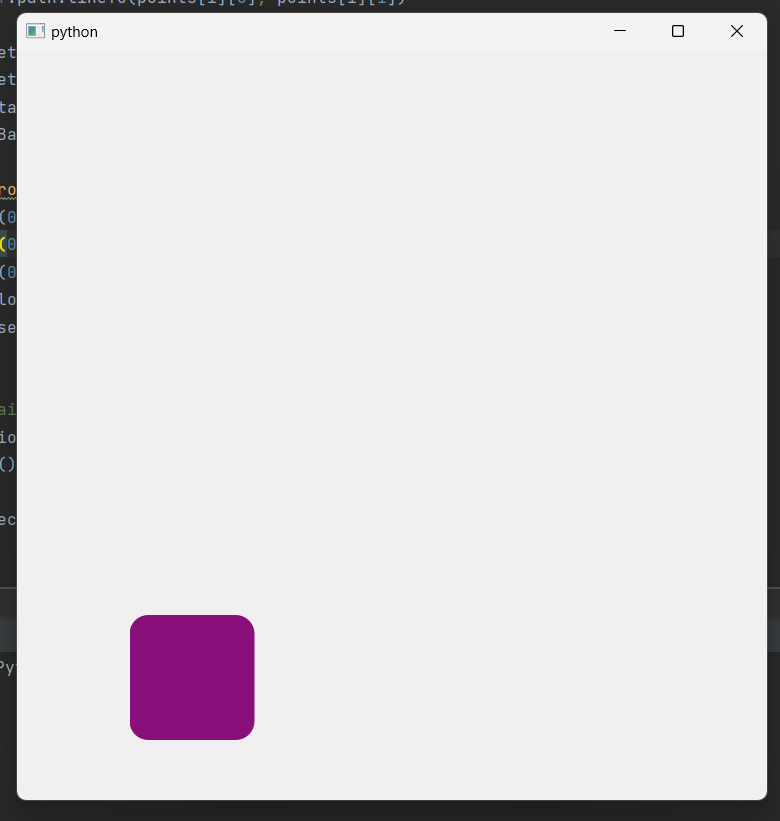
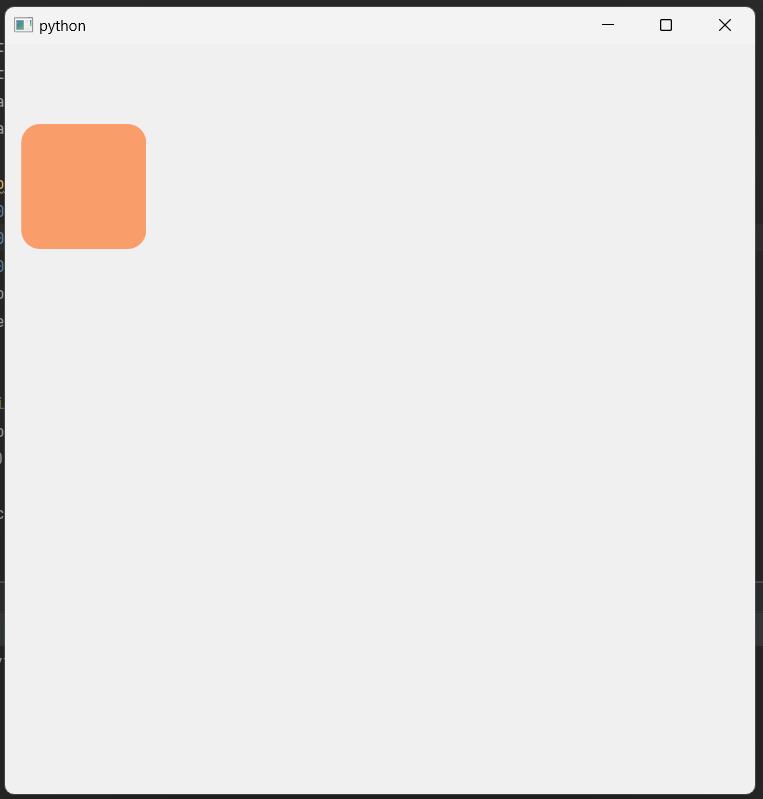
1 2 3 4 5 6 7 8 9 10 11 12 13 14 15 16 17 18 19 20 21 22 23 24 25 26 27 28 29 30 31 32 33 34 35 36 37 38 39 40 41 42 43 44 45 46 47 48 49 50 51 52 53 54 55 56 57 58 59 60 61 62 63 64 65 66 67 68 | import sys from PyQt6.QtWidgets import QApplication, QWidget from PyQt6.QtCore import QPropertyAnimation, QRect, QSize, Qt from PyQt6.QtGui import QColor, QPainterPath, QPainter, QPaintEvent from random import randint class Window(QWidget): def __init__(self): super().__init__() self.resize(600, 600) self.child = QWidget(self) self.child.setGeometry(QRect(250, 250, 100, 100)) self.path = QPainterPath() self.path.moveTo(300, 300) self.path.cubicTo(400, 100, 200, 400, 300, 500) self.anim = QPropertyAnimation(self.child, b“pos”) self.anim.setStartValue(self.path.pointAtPercent(0)) self.anim.setEndValue(self.path.pointAtPercent(1)) self.anim.setDuration(2000) self.anim.finished.connect(self.animateFinished) self.anim.start() self.changeBackgroundColor() def animateFinished(self): self.path = QPainterPath() self.path.moveTo(self.path.pointAtPercent(1)) points = [ (100, 100), (300, 100), (400, 300), (500, 100), (700, 100), (500, 300), (700, 500), (500, 500), (400, 700), (300, 500), (100, 500), (300, 300) ] for i in range(len(points)): if i < len(points) – 1: self.path.lineTo(points[i][0], points[i][1]) self.anim.setStartValue(self.path.pointAtPercent(0)) self.anim.setEndValue(self.path.pointAtPercent(1)) self.anim.start() self.changeBackgroundColor() def changeBackgroundColor(self): r = randint(0, 255) g = randint(0, 255) b = randint(0, 255) color = QColor(r, g, b) self.child.setStyleSheet(f“background-color: {color.name()};border-radius:15px;”) if __name__ == “__main__”: app = QApplication(sys.argv) window = Window() window.show() sys.exit(app.exec()) | cs |
2. PyQt6 Animation 응용 예시
PyQt6를 사용하여 간단한 통계를 보여주는 애플리케이션을 구현한 예제입니다. 코드를 살펴보면 다음과 같은 구성 요소가 있습니다
1 2 3 4 5 6 7 8 9 10 11 12 13 14 15 16 17 18 19 20 21 22 23 24 25 26 27 28 29 30 31 32 33 34 35 36 37 38 39 40 41 42 43 44 45 46 47 48 49 50 51 52 53 54 55 56 57 58 59 60 61 62 63 64 65 66 67 68 69 70 71 72 73 74 75 76 77 78 79 80 81 82 83 84 85 | import sys import random import time from PyQt6.QtWidgets import QApplication, QMainWindow, QWidget, QVBoxLayout, QProgressBar, QLabel from PyQt6.QtCore import Qt, QPropertyAnimation, QThread, pyqtSignal, pyqtSlot class StatisticsWidget(QWidget): def __init__(self): super().__init__() self.values = [0] * 10 self.bars = [] self.labels = [] vbox_layout = QVBoxLayout() for i in range(10): bar = QProgressBar() bar.setRange(0, 100) bar.setTextVisible(False) bar.setAlignment(Qt.AlignmentFlag.AlignRight | Qt.AlignmentFlag.AlignVCenter) vbox_layout.addWidget(bar) self.bars.append(bar) label = QLabel() vbox_layout.addWidget(label) self.labels.append(label) self.setLayout(vbox_layout) def update_statistics(self, data): self.values[data // 10] += 1 total_values = sum(self.values) for i in range(10): bar = self.bars[i] label = self.labels[i] value = self.values[i] percentage = (value / total_values) * 100 if total_values != 0 else 0 bar.setRange(0, total_values) bar.setValue(value) label.setText(f“{value}/{total_values} ({percentage:.2f}%)”) class DataGenerator(QThread): updated = pyqtSignal(int) def run(self): while True: data = random.randint(0, 100) self.updated.emit(data) time.sleep(0.1) class MainWindow(QMainWindow): def __init__(self): super().__init__() self.setGeometry(800, 200, 320, 340) self.statistics_widget = StatisticsWidget() vbox_layout = QVBoxLayout() vbox_layout.addWidget(self.statistics_widget) central_widget = QWidget() central_widget.setLayout(vbox_layout) self.setCentralWidget(central_widget) self.data_generator = DataGenerator() self.data_generator.updated.connect(self.update_statistics) self.data_generator.start() @pyqtSlot(int) def update_statistics(self, data): self.statistics_widget.update_statistics(data) if __name__ == “__main__”: app = QApplication(sys.argv) window = MainWindow() window.show() sys.exit(app.exec()) | cs |
[실행화면]
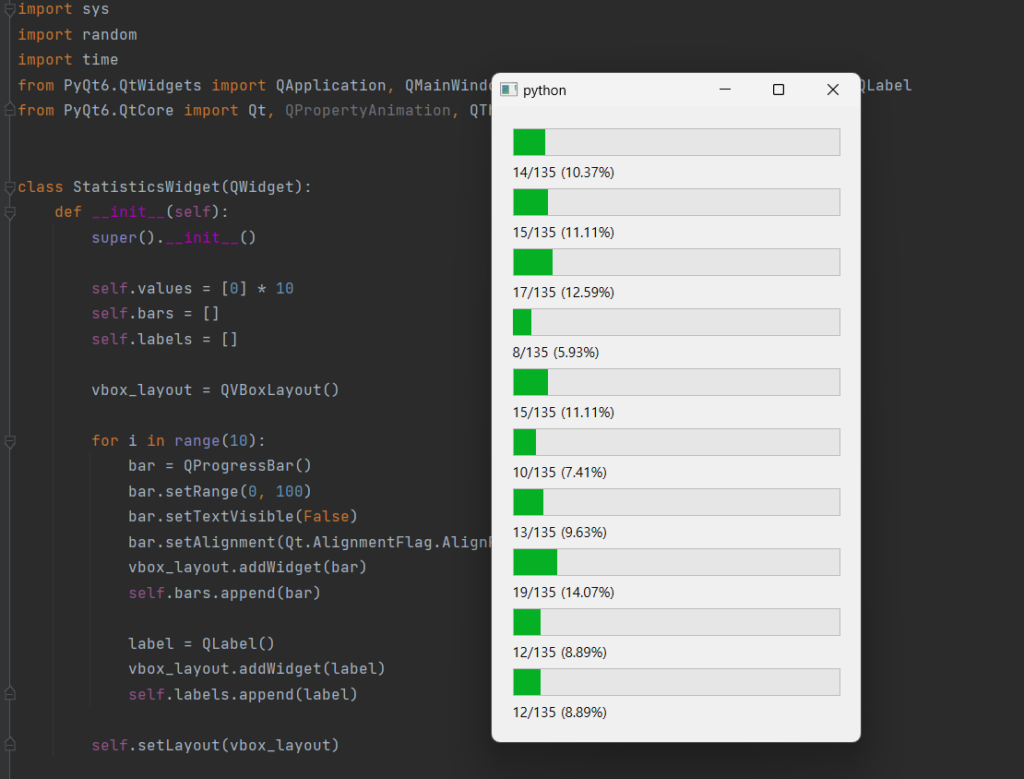
StatisticsWidget: 통계를 보여주는 위젯입니다. 10개의 프로그래스 바와 레이블로 구성되어 있습니다. update_statistics 메서드를 통해 통계 데이터를 받아 각각의 프로그래스 바와 레이블을 업데이트합니다.
DataGenerator: 무작위 데이터를 생성하는 백그라운드 스레드입니다. run 메서드에서 무작위로 0부터 100 사이의 데이터를 생성하고, updated 시그널을 발생시켜 데이터를 전달합니다.
MainWindow: 메인 창으로서 StatisticsWidget을 포함하고 있습니다. DataGenerator를 생성하고 updated 시그널과 update_statistics 슬롯을 연결하여 통계 데이터를 업데이트합니다.
애플리케이션이 실행되면 MainWindow가 생성되고, DataGenerator가 백그라운드에서 데이터를 생성하여 StatisticsWidget을 업데이트합니다. 각 프로그래스 바는 해당 데이터 범위 내에서의 횟수를 나타내며, 레이블은 해당 횟수와 전체 횟수에 대한 백분율을 보여줍니다.
[관련글]